|
The
MUF's are back, now as a magic T index
|
DX-Torpet
Skåne
DXer:
Hermod Pedersen
CV: DXing since 1971, focusing on
Latin American radio stations. Have been president of the Swedish DX
Federation, and started its first Bulletin Board in 1990. Started the
Nordic Shortwave Center web site, later merged with HCDX.
Having retired, after 40 years in journalism, I now have more time for
radio adventures.
|
| My
links |
|
 MW list MW list
K index
Ydun's MW
MV-Eko
Shortwave Bulletin
MW Circle
China list
Cuba list
Brazil AM
FCC AM
DX Links
More DX Links
|
| About
this site |
Starting DXing
again, I need an online service to keep up with things. So this is a site
for my own pleasure, updated with what I want, when needed.
As I don't like Facebook, Instagram,
Blogger, Wordpress or other so-called free social media plattform (all they
want is to make money on our data), I do this on my own site.
So no need to worry about cookies, ads,
fancy hidden gizmos; this is just plain HTML, the way it all once started.
Contact
|
|
|
Maximum Useable
Frequency, or MUF, has recently seen a resurgence in DX circles.
In the past, when the interest in shortwave was at its strongest,
the thing with MUF was a hot thing. Not least during the Cold
War.
Which wasn't that strange.
With a number of stations in a limited space, it was a matter
of finding the best possible opening. And if the propagation conditions
on shortwave for a certain time also favored higher frequencies,
so much the better. With more frequencies available, the limited
space for the shortwave transmitters became less crowded.
Did this affect reception on the lowest frequencies such as medium
wave, long wave and the VLF of the submarine world?
 No. No.
Nevertheless, interest in MUF,
the Maximum Useable Frequency, has recently gone into self-oscillation.
Not as MUF.
But as a magical T-index.
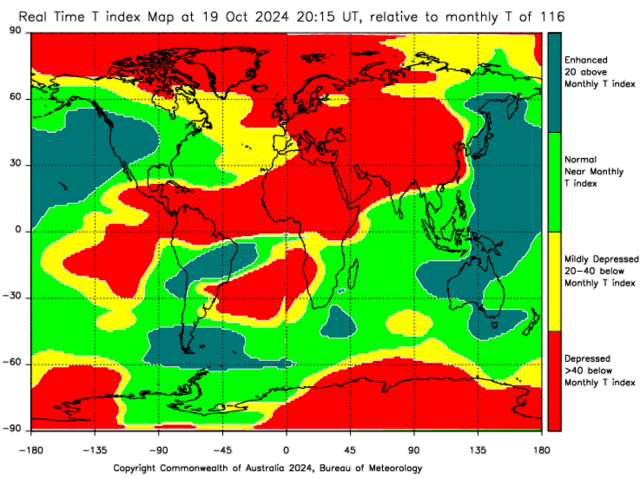
Now, we are told, we can predict which signals we will hear, and
which we will not hear. A constantly updated T-index map will
give you a magical world map showing where "the ionospheric
absorption is high and reception over those areas is degraded".
You may see the areas and frequencies with exceptional DX signals
on medium wave. And all those without.
Fantastic!
Real-time
T index difference map
No, of course you won't.
The T-index, to quote the researchers
in Australia, is "an index derived from observed
values of maximum ionospheric frequencies and has the same scale
as the number of sunspots."
From this it is possible to obtain a relationship between frequency
and a number of sunspots. Which can then be used to create better,
faster forecasts for possible shortwave communications. In short,
to find the highest maximum usable frequencies.
Good old MUF.
Which, of course, does not change previously known propagation
conditions:
Low T index values still mean use of the lower HF frequencies
such as around solar minimum or during a strong ionospheric storm.
Higher T indices and therefore higher frequencies will usually
be the norm near solar maximum.
All of this has little to do
with the propagation ratio at the lowest frequencies. Here, too,
it may be wise to study long-term research findings, which show
that aurora effects are more important at low frequencies. Or
in short, if a large number of signals are knocked out by polar
cap absorption, it opens up signals coming from areas closer to
the equator, because those signals are not as affected.
And now for the holy grail:
How do I predict these signal openings on the lower broadcast
bands?
You can't.
At least not very reliable.
But with all the research into solar weather (thanks to satellites,
GPS, space travel and robotic shields), we are getting step by
step closer to utopia. But for the foreseeable time, you will
still have to rely on well-known, proven techniques to predict
propagation conditions, i.e. K-index, magnetometers, protons,
sunspots, solar winds and polar cap absorption.
|